Dosya:1960- Tax rates of richest versus low income people - US.svg

Bu SVG dosyasının PNG önizlemesinin boyutu: 800 × 600 piksel. Diğer çözünürlükler: 320 × 240 piksel | 640 × 480 piksel | 1.024 × 768 piksel | 1.280 × 960 piksel | 2.560 × 1.920 piksel | 1.000 × 750 piksel.
Tam çözünürlük (SVG dosyası, sözde 1.000 × 750 piksel, dosya boyutu: 6 KB)
Bu dosya Wikimedia Commons'ta bulunmaktadır. Dosyanın açıklaması aşağıda gösterilmiştir. Commons, serbest/özgür telifli medya dosyalarının bulundurulduğu depodur. Siz de yardım edebilirsiniz. |
Özet
| Açıklama |
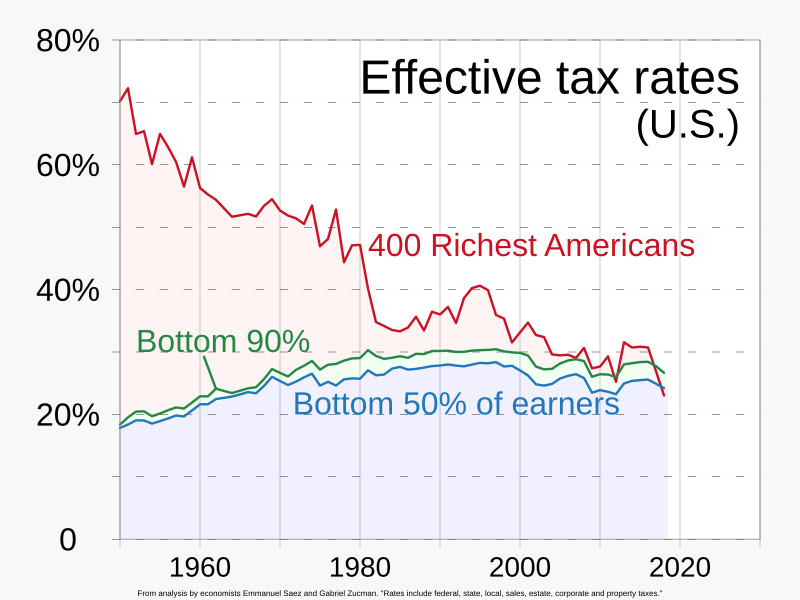
English: Chart comparing effective total (federal and state and local) tax rates in the United States, of the richest Americans and those in the bottom 50% of earners
|
||
| Tarih | |||
| Kaynak | Yükleyenin kendi çalışması | ||
| Yazar | RCraig09 |

Lisanslama
Ben, bu işin telif sahibi, burada işi aşağıdaki lisans altında yayımlıyorum:
Bu dosya, Creative Commons Atıf-Benzer Paylaşım 4.0 Uluslararası lisansı ile lisanslanmıştır.
- Şu seçeneklerde özgürsünüz:
- paylaşım – eser paylaşımı, dağıtımı ve iletimi
- içeriği değiştirip uyarlama – eser adaptasyonu
- Aşağıdaki koşullar geçerli olacaktır:
- atıf – Esere yazar veya lisans sahibi tarafından belirtilen (ancak sizi ya da eseri kullanımınızı desteklediklerini ileri sürmeyecek bir) şekilde atıfta bulunmalısınız.
- benzer paylaşım – Maddeyi yeniden karıştırır, dönüştürür veya inşa ederseniz, katkılarınızı orijinal olarak aynı veya uyumlu lisans altında dağıtmanız gerekir.
Dosya geçmişi
Dosyanın herhangi bir zamandaki hâli için ilgili tarih/saat kısmına tıklayın.
| Tarih/Saat | Küçük resim | Boyutlar | Kullanıcı | Yorum | |
|---|---|---|---|---|---|
| güncel | 16.28, 15 Mayıs 2024 | | 1.000 × 750 (6 KB) | RCraig09 | Version 3: add green segment between "Bottom 90%" and green line, to avoid inference that "Bottom 90%P applies to light red area |
| 05.37, 15 Mayıs 2024 |  | 1.000 × 750 (6 KB) | RCraig09 | Version 2: Update using source from CBS News . . . 3 traces rather than two . . . . 1950- rather than 1960- . . . revised footer | |
| 05.44, 8 Mayıs 2024 |  | 1.000 × 750 (5 KB) | RCraig09 | Uploaded own work with UploadWizard |
Dosya kullanımı
Bu görüntü dosyasına bağlantısı olan sayfalar:
Küresel dosya kullanımı
Aşağıdaki diğer vikiler bu dosyayı kullanır:
- en.wikipedia.org üzerinde kullanımı
- Economic inequality
- Income tax in the United States
- Affluence in the United States
- Income inequality in the United States
- Wealth inequality in the United States
- Talk:Wealth inequality in the United States
- Tax policy and economic inequality in the United States
- Causes of income inequality in the United States