Dosya:WeierstrassFunction.svg

Bu SVG dosyasının PNG önizlemesinin boyutu: 795 × 505 piksel. Diğer çözünürlükler: 320 × 203 piksel | 640 × 407 piksel | 1.024 × 650 piksel | 1.280 × 813 piksel | 2.560 × 1.626 piksel.
Tam çözünürlük (SVG dosyası, sözde 795 × 505 piksel, dosya boyutu: 120 KB)
Bu dosya Wikimedia Commons'ta bulunmaktadır. Dosyanın açıklaması aşağıda gösterilmiştir. Commons, serbest/özgür telifli medya dosyalarının bulundurulduğu depodur. Siz de yardım edebilirsiniz. |
Özet
| Açıklama |
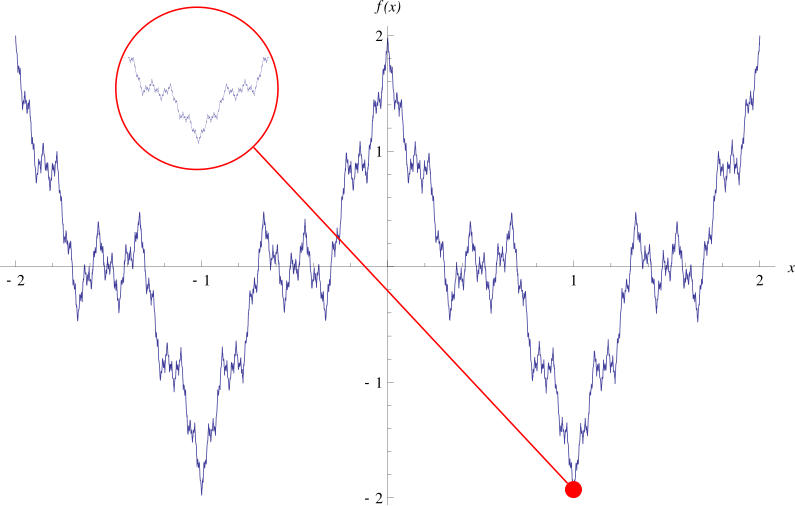
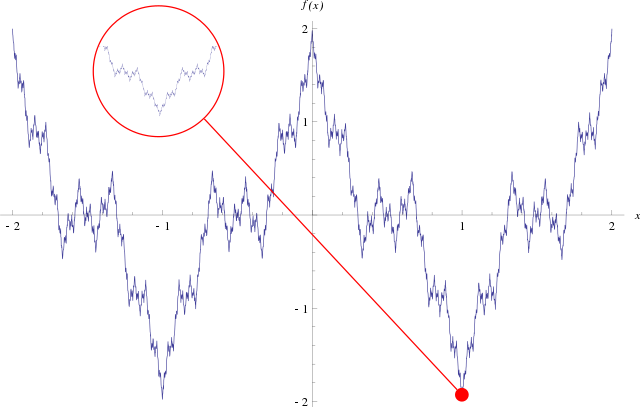
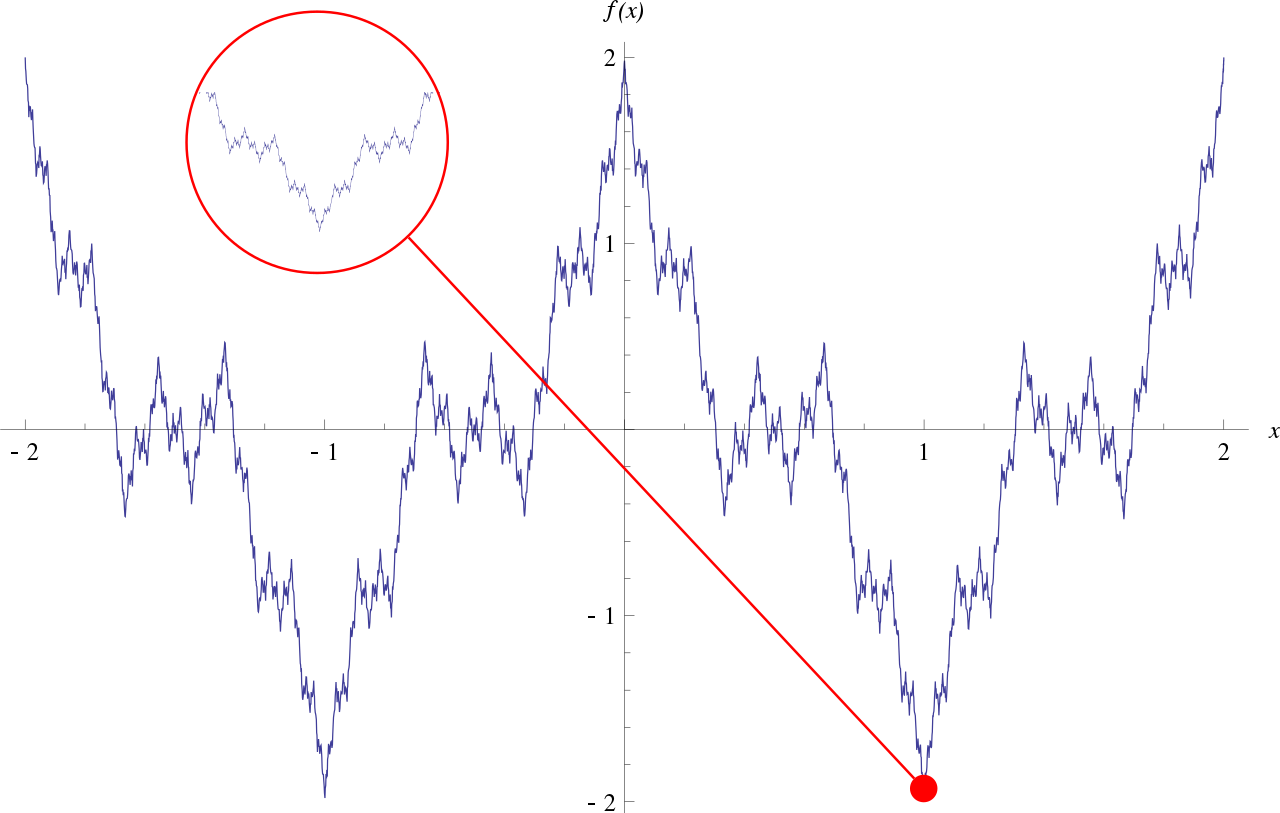
English: Plot of the Weierstrass function. A section of the plot is zoomed in on to illustrate the fractal nature of the function. The plot was generated using Mathematica and exported to SVG. I first made a plot of the region and then a plot of a much smaller section around the red point on the image. With the use of Inkscape, I was able to put the two in the same SVG file. This file is an Inkscape SVG, not a plain SVG. |
| Tarih | |
| Kaynak | Yükleyenin kendi çalışması |
| Yazar | Eeyore22 |
| Diğer sürümler | File:Weierstrass_function.gif |
W3C-validity not checked.
Lisanslama
| Ben, bu işin telif sahibi, bu işi kamu malı olarak yayınlıyorum. Bu dünya çapında geçerlidir. Bazı ülkelerde bu yasal olarak mümkün olmayabilir; öyleyse: Ben, bu işi herhangi bir amaç için, herhangi bir şart olmaksızın, yasalarca gerekli olmadıkça, herkesin kullanmasına izin veriyorum. |
Dosya geçmişi
Dosyanın herhangi bir zamandaki hâli için ilgili tarih/saat kısmına tıklayın.
| Tarih/Saat | Küçük resim | Boyutlar | Kullanıcı | Yorum | |
|---|---|---|---|---|---|
| güncel | 00.44, 27 Ekim 2008 | | 795 × 505 (120 KB) | Eeyore22~commonswiki | {{Information |Description={{en|1=Plot of the Weierstrass function. A section of the plot is zoomed in on to illustrate the fractal nature of the function.}} |Source=Own work by uploader |Author=Eeyore22 |Date=October 26, 2008 |Permissio |
Dosya kullanımı
Bu görüntü dosyasına bağlantısı olan sayfalar:
Küresel dosya kullanımı
Aşağıdaki diğer vikiler bu dosyayı kullanır:
- ar.wikipedia.org üzerinde kullanımı
- bg.wikipedia.org üzerinde kullanımı
- ca.wikipedia.org üzerinde kullanımı
- cs.wikipedia.org üzerinde kullanımı
- cv.wikipedia.org üzerinde kullanımı
- de.wikipedia.org üzerinde kullanımı
- de.wikiversity.org üzerinde kullanımı
- Kurs:Mathematik für Anwender (Osnabrück 2011-2012)/Teil I/Vorlesung 15
- Kurs:Mathematik für Anwender (Osnabrück 2011-2012)/Teil I/Vorlesung 15/kontrolle
- Kurs:Analysis (Osnabrück 2013-2015)/Teil I/Vorlesung 12
- Kurs:Analysis (Osnabrück 2014-2016)/Teil I/Vorlesung 12
- Kurs:Analysis (Osnabrück 2014-2016)/Teil I/Vorlesung 12/kontrolle
- Kurs:Grundkurs Mathematik (Osnabrück 2016-2017)/Teil II/Vorlesung 51
- Kurs:Grundkurs Mathematik (Osnabrück 2016-2017)/Teil II/Vorlesung 51/kontrolle
- Kurs:Grundkurs Mathematik (Osnabrück 2018-2019)/Teil II/Vorlesung 51
- Kurs:Grundkurs Mathematik (Osnabrück 2018-2019)/Teil II/Vorlesung 51/kontrolle
- Kurs:Mathematik für Anwender (Osnabrück 2019-2020)/Teil I/Vorlesung 10
- Kurs:Mathematik für Anwender (Osnabrück 2019-2020)/Teil I/Vorlesung 10/kontrolle
- Kurs:Mathematik für Anwender (Osnabrück 2019-2020)/Teil I/Repetitorium/Vorlesung 10
- Kurs:Mathematik für Anwender (Osnabrück 2020-2021)/Teil I/Vorlesung 10
- Kurs:Mathematik für Anwender (Osnabrück 2020-2021)/Teil I/Vorlesung 10/kontrolle
- Kurs:Analysis (Osnabrück 2021-2023)/Teil I/Vorlesung 12
- Stetige Funktion/K/Motivation/Einführung/Textabschnitt
- Kurs:Analysis (Osnabrück 2021-2023)/Teil I/Vorlesung 12/kontrolle
- Kurs:Grundkurs Mathematik (Osnabrück 2022-2023)/Teil II/Vorlesung 51
- Kurs:Grundkurs Mathematik (Osnabrück 2022-2023)/Teil II/Vorlesung 51/kontrolle
- Kurs:Analysis (Osnabrück 2013-2015)/Teil I/Vorlesung 12/kontrolle
- Reelle Zahlen/Stetige Funktionen/Motivation/Einführung/Textabschnitt
- Kurs:Maßtheorie auf topologischen Räumen/Differenzierbarkeit in Analysis und Funktiontheorie
- Reelle Funktionen/Stetig/Einführung/Textabschnitt
- Kurs:Mathematik für Anwender (Osnabrück 2023-2024)/Teil I/Vorlesung 10
- Kurs:Mathematik für Anwender (Osnabrück 2023-2024)/Teil I/Vorlesung 10/kontrolle
- el.wikipedia.org üzerinde kullanımı
- en.wikipedia.org üzerinde kullanımı
- en.wikibooks.org üzerinde kullanımı
- en.wikiversity.org üzerinde kullanımı
- Real numbers/Continuous functions/Motivation/Introduction/Section
- Mathematics for Applied Sciences (Osnabrück 2023-2024)/Part I/Lecture 10
- Mathematics for Applied Sciences (Osnabrück 2023-2024)/Part I/Lecture 10/latex
- Mathematics for Applied Sciences (Osnabrück 2023-2024)/Part I/Lecture 10/refcontrol
- en.wiktionary.org üzerinde kullanımı
- es.wikipedia.org üzerinde kullanımı
- et.wikipedia.org üzerinde kullanımı
- eu.wikipedia.org üzerinde kullanımı
- fa.wikipedia.org üzerinde kullanımı
- fr.wikipedia.org üzerinde kullanımı
Bu dosyanın daha fazla küresel kullanımını görüntüle.