Dosya:Tautochrone curve.gif

Tautochrone_curve.gif((300 × 200 piksel, dosya boyutu: 102 KB, MIME tipi: image/gif), döngüye girdi, 80 kare, 3,2 sn)


Özet

Açıklama

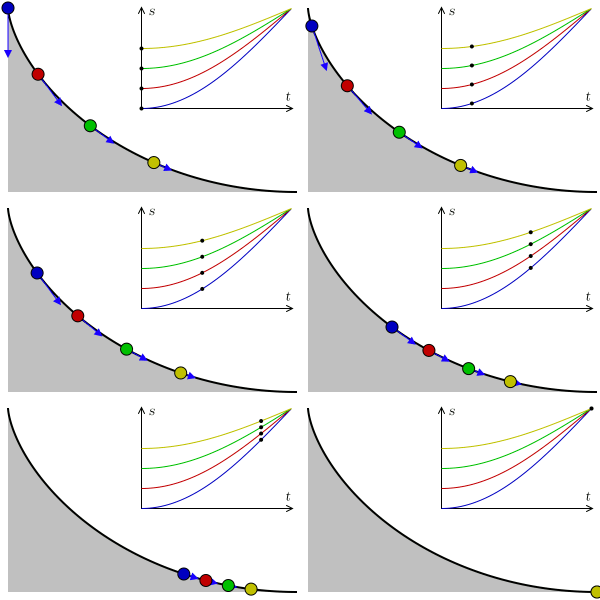
A tautochrone curve is the curve for which the time taken by an object sliding without friction in uniform gravity to its lowest point is independent of its starting point. Here, four points at different positions reach the bottom at the same time.


In the graphic, s represents arc length, t represents time, and the blue arrows represent acceleration along the trajectory. As the points reach the horizontal, the velocity becomes constant, the arc length being linear to time.
Tarih 9 Mayıs 2007; new version Ağustos 2009
Kaynak Yükleyenin kendi çalışması
Yazar

Claudio Rocchini

rewritten by Geek3
GIF gelişimi
InfoField
 
Bu GIF grafik Matplotlib ile oluşturuldu.
Kaynak kodu
InfoField

Python code

#!/usr/bin/python
# -*- coding: utf8 -*-

'''
animation of balls on a tautochrone curve
'''

import os
import numpy as np
import matplotlib.pyplot as plt
import matplotlib.patches as patches
from matplotlib import animation
from math import *

# settings
fname = 'Tautochrone curve'
width, height = 300, 200
nframes = 80
fps=25

balls = [
{'a':1.0, 'color':'#0000c0'},
{'a':0.8, 'color':'#c00000'},
{'a':0.6, 'color':'#00c000'},
{'a':0.4, 'color':'#c0c000'}]

def curve(phi):
    x = phi + sin(phi)
    y = 1.0 - cos(phi)
    return np.array([x, y])

def animate(nframe, empty=False):
    t = nframe / float(nframes - 1.)
    
    # prepare a clean and image-filling canvas for each frame
    fig = plt.gcf()
    fig.clf()
    ax_canvas = plt.gca()
    ax_canvas.set_position((0, 0, 1, 1))
    ax_canvas.set_xlim(0, width)
    ax_canvas.set_ylim(0, height)
    ax_canvas.axis('off')
    
    # draw the ramp
    x0, y0 = 293, 8
    h = 182
    npoints = 200
    points = []
    for i in range(npoints):
        phi = i / (npoints - 1.0) * pi - pi
        x, y = h/2. * curve(phi) + np.array([x0, y0])
        points.append([x, y])
    
    rampline = patches.Polygon(points, closed=False, facecolor='none',
                       edgecolor='black', linewidth=1.5, capstyle='butt')
    points += [[x0-h*pi/2, y0], [x0-h*pi/2, y0+h]]
    
    ramp = patches.Polygon(points, closed=True, facecolor='#c0c0c0', edgecolor='none')
    
    # plot axes
    plotw = 0.5
    ax_plot = fig.add_axes((0.47, 0.46, plotw, plotw*2/pi*width/height))
    ax_plot.set_xlim(0, 1)
    ax_plot.set_ylim(0, 1)
    for b in balls:
        time_array = np.linspace(0, 1, 201)
        phi_pendulum_array = (1 - b['a'] * np.cos(time_array*pi/2))
        ax_plot.plot(time_array, phi_pendulum_array, '-', color=b['color'], lw=.8)
    ax_plot.set_xticks([])
    ax_plot.set_yticks([])
    ax_plot.set_xlabel('t')
    ax_plot.set_ylabel('s')
    
    ax_canvas.add_patch(ramp)
    ax_canvas.add_patch(rampline)
    
    for b in balls:
        # draw the balls
        phi_pendulum = b['a'] * -cos(t * pi/2)
        phi_wheel = 2 * asin(phi_pendulum)
        phi_wheel = -abs(phi_wheel)
        x, y = h/2. * curve(phi_wheel) + np.array([x0, y0])
        ax_canvas.add_patch(patches.Circle((x, y), radius=6., zorder=3,
                            facecolor=b['color'], edgecolor='black'))
        ax_plot.plot([t], [1 + phi_pendulum], '.', ms=6., mec='none', mfc='black')
        
        v = h/2. * np.array([1 + cos(phi_wheel), sin(phi_wheel)])
        vnorm = v / hypot(v[0], v[1])
        # in the harmonic motion, acceleration is proportional to -position
        acc_along_line = 38. * -phi_pendulum * vnorm
        ax_canvas.arrow(x, y, acc_along_line[0], acc_along_line[1],
                 head_width=6, head_length=6, fc='#1b00ff', ec='#1b00ff')

fig = plt.figure(figsize=(width/100., height/100.))
print 'saving', fname + '.gif'
#anim = animation.FuncAnimation(fig, animate, frames=nframes)
#anim.save(fname + '.gif', writer='imagemagick', fps=fps)

frames = []
for nframe in range(nframes):
    frame = fname + '_{:02}.png'.format(nframe)
    animation.FuncAnimation(fig, lambda n: animate(nframe), frames=1).save(
        frame, writer='imagemagick')
    frames.append(frame)

# assemble animation using imagemagick, this avoids dithering and huge filesize
os.system('convert -delay {} +dither +remap -layers Optimize {} "{}"'.format(
    100//fps, ' '.join(['"' + f + '"' for f in frames]), fname + '.gif'))
for frame in frames:
    if os.path.exists(frame):
        os.remove(frame)

Lisanslama

Ben, bu işin telif sahibi, burada işi aşağıdaki lisanslar altında yayımlıyorum:
GNU head Bu belgenin GNU Özgür Belgeleme Lisansı, Sürüm 1.2 veya Özgür Yazılım Vakfı tarafından yayımlanan sonraki herhangi bir sürüm şartları altında bu belgenin kopyalanması, dağıtılması ve/veya değiştirilmesi için izin verilmiştir;

Değişmeyen Bölümler, Ön Kapak Metinleri ve Arka Kapak Metinleri yoktur. Lisansın bir kopyası GNU Özgür Belgeleme Lisansı sayfasında yer almaktadır.

w:tr:Creative Commons
atıf benzer paylaşım
Bu dosya, Creative Commons Atıf-Benzer Paylaşım 3.0 Taşınmamış lisansı ile lisanslanmıştır
Şu seçeneklerde özgürsünüz:
  • paylaşım – eser paylaşımı, dağıtımı ve iletimi
  • içeriği değiştirip uyarlama – eser adaptasyonu
Aşağıdaki koşullar geçerli olacaktır:
  • atıf – Esere yazar veya lisans sahibi tarafından belirtilen (ancak sizi ya da eseri kullanımınızı desteklediklerini ileri sürmeyecek bir) şekilde atıfta bulunmalısınız.
  • benzer paylaşım – Maddeyi yeniden karıştırır, dönüştürür veya inşa ederseniz, katkılarınızı orijinal olarak aynı veya uyumlu lisans altında dağıtmanız gerekir.
Bu lisanslama etiketi, dosyaya GFDL lisanslama güncelleştirmenin bir parçası olarak eklenmiştir.
w:tr:Creative Commons
atıf
Bu dosya, Creative Commons Atıf 2.5 Genel lisansı ile lisanslanmıştır
Şu seçeneklerde özgürsünüz:
  • paylaşım – eser paylaşımı, dağıtımı ve iletimi
  • içeriği değiştirip uyarlama – eser adaptasyonu
Aşağıdaki koşullar geçerli olacaktır:
  • atıf – Esere yazar veya lisans sahibi tarafından belirtilen (ancak sizi ya da eseri kullanımınızı desteklediklerini ileri sürmeyecek bir) şekilde atıfta bulunmalısınız.
İstediğiniz lisansı seçebilirsiniz.

Altyazılar

Bu dosyanın temsil ettiği şeyin tek satırlık açıklamasını ekleyin.

Bu dosyada gösterilen öğeler

betimlenen

9 Mayıs 2007

image/gif

Dosya geçmişi

Dosyanın herhangi bir zamandaki hâli için ilgili tarih/saat kısmına tıklayın.

Tarih/SaatKüçük resimBoyutlarKullanıcıYorum
güncel13.15, 1 Ağustos 200913.15, 1 Ağustos 2009 tarihindeki sürümün küçültülmüş hâli300 × 200 (102 KB)Geek3new physically correct version
06.56, 9 Mayıs 200706.56, 9 Mayıs 2007 tarihindeki sürümün küçültülmüş hâli300 × 200 (602 KB)Rocchini{{Information |Description=Tautochrone curve animation (4 points runs over a cycloid) |Source=Own work |Date=2007-05-09 |Author=Claudio Rocchini |Permission=CC-BY 2.5 }}

Bu görüntü dosyasına bağlantısı olan sayfalar:

Küresel dosya kullanımı

Aşağıdaki diğer vikiler bu dosyayı kullanır: