Dosya:Serpentine curve.png
Bu önizlemenin boyutu: 798 × 144 piksel. Diğer çözünürlükler: 320 × 58 piksel | 2.054 × 371 piksel.
Tam çözünürlük ((2.054 × 371 piksel, dosya boyutu: 8 KB, MIME tipi: image/png))
Bu dosya Wikimedia Commons'ta bulunmaktadır. Dosyanın açıklaması aşağıda gösterilmiştir. Commons, serbest/özgür telifli medya dosyalarının bulundurulduğu depodur. Siz de yardım edebilirsiniz. |
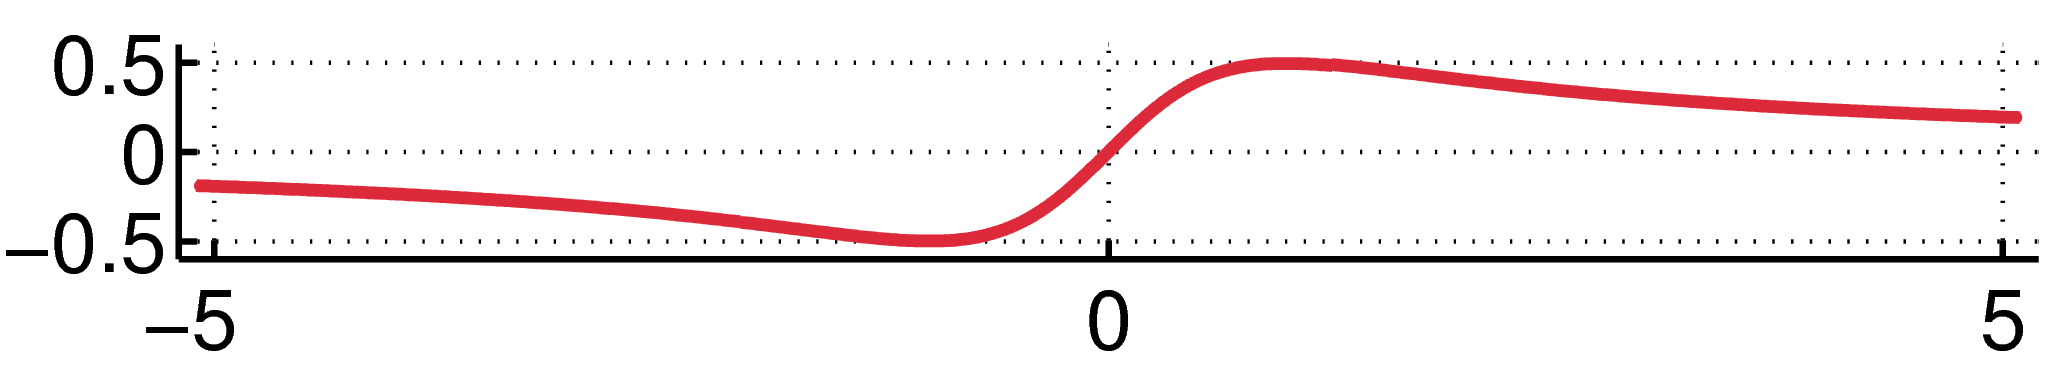
| Açıklama | Illustration of Serpentine curve |
| Tarih | (UTC) |
| Kaynak | self-made with en:Matlab |
| Yazar | Oleg Alexandrov |
| Ben, bu işin telif sahibi, bu işi kamu malı olarak yayınlıyorum. Bu dünya çapında geçerlidir. Bazı ülkelerde bu yasal olarak mümkün olmayabilir; öyleyse: Ben, bu işi herhangi bir amaç için, herhangi bir şart olmaksızın, yasalarca gerekli olmadıkça, herkesin kullanmasına izin veriyorum. |
Source code (MATLAB)
% Serpentine curve illustration

function main()

   % linewidth and font size
   lw= 6;
   fs = 20;

% colors
   red=[0.867 0.06 0.14];
   blue = [0, 129, 205]/256;
   green = [0, 200,  70]/256;
   black = [0, 0, 0];
   white = 0.99*[1, 1, 1];


   N=500;  % number of points (don't make it big, code will be slow)

   Lx1 = -5; Lx2 = 5; Ly1 = -4; Ly2 = -Ly1;

   bd = 0.1;
   for i = 1:2

% Set up the plotting window
	  figure(1); clf; set(gca, 'fontsize', fs, 'linewidth', lw/4);
	  hold on; axis equal; grid on;
	  figure(2); clf; hold on; axis equal; axis off;

	  [X, Y]=meshgrid(linspace(Lx1, Lx2, N), linspace(Ly1, Ly2, N));

	  x = X; y = Y;
	  a = 1; b = 1;
	  Z = x.^2.*y+a*b*y-a^2*x;

%  graph the curves using 'contour' in figure (2)
	  figure(2); [c, stuff] = contour(X, Y, Z, [0, 0]);

%  extract the curves from c and graph them in figure(1) using 'plot'
%  need to do this kind of convoluted work since plot2svg can't save
%  the result of 'contour' but can save the result of 'plot'


	  [m, n] = size(c);
	  while n > 0

		 l=c(2, 1);
		 x=c(1,2:(l+1));  y=c(2,2:(l+1)); % get x and y of contours
		 figure(1); plot(x, y, 'color', red, 'linewidth', lw/2);

		 c = c(:, (l+2):n);
		 [m, n] = size(c);

%		 Lx1 = min(Lx1, min(x) - bd); Lx2 = max(Lx2, max(x) + bd);
%		 Ly1 = min(Ly1, min(y) - bd); Ly2 = max(Ly2, max(y) + bd);
		 Lx1 = min(x) - bd; Lx2 = max(x) + bd;
		 Ly1 = min(y) - bd; Ly2 = max(y) + bd;
	  end

	  figure(1); axis equal; axis ([Lx1, Lx2, Ly1, Ly2]);
   end

   saveas(gcf, 'Serpentine curve.eps', 'psc2')
Dosya geçmişi
Dosyanın herhangi bir zamandaki hâli için ilgili tarih/saat kısmına tıklayın.
| Tarih/Saat | Küçük resim | Boyutlar | Kullanıcı | Yorum | |
|---|---|---|---|---|---|
| güncel | 05.48, 19 Nisan 2017 | 2.054 × 371 (8 KB) | Ayane m | 57% file size reduction | |
| 15.43, 14 Temmuz 2007 | 2.054 × 371 (18 KB) | Oleg Alexandrov | {{Information |Description=Illustration of Serpentine curve |Source=self-made with en:Matlab |Date= ~~~~~ |Author= Oleg Alexandrov }} {{PD-self}} ==Source code (MATLAB)== <pre> <nowiki> % Serpentin |
Dosya kullanımı
Bu görüntü dosyasına bağlantısı olan sayfalar:
Küresel dosya kullanımı
Aşağıdaki diğer vikiler bu dosyayı kullanır:
- ca.wikipedia.org üzerinde kullanımı
- en.wikipedia.org üzerinde kullanımı
- es.wikipedia.org üzerinde kullanımı
- fi.wikipedia.org üzerinde kullanımı
- sl.wikipedia.org üzerinde kullanımı
- zh.wikipedia.org üzerinde kullanımı