Dosya:Mpl screenshot figures and code.png

Bu önizlemenin boyutu: 752 × 599 piksel. Diğer çözünürlükler: 301 × 240 piksel | 602 × 480 piksel | 964 × 768 piksel | 1.227 × 978 piksel.
Tam çözünürlük ((1.227 × 978 piksel, dosya boyutu: 350 KB, MIME tipi: image/png))
Bu dosya Wikimedia Commons'ta bulunmaktadır. Dosyanın açıklaması aşağıda gösterilmiştir. Commons, serbest/özgür telifli medya dosyalarının bulundurulduğu depodur. Siz de yardım edebilirsiniz. |
Özet
| Açıklama |
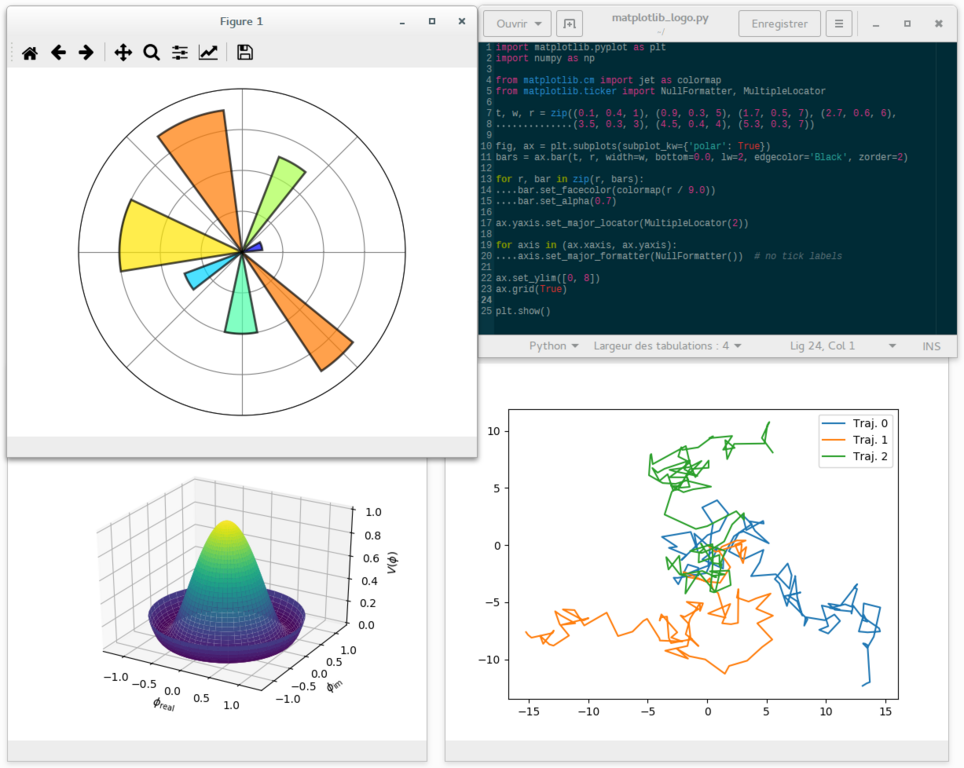
English: A screenshot showing matplotlib plots of a polar bar graph resembling the matplotlib logo (upper left), a 3D surface graph with the new default 'viridis' colormap (lower left), a graph of 2D random walk trajectories (lower right), and the python source code (of the logo part) opened in a text editor (upper right). |
| Tarih | |
| Kaynak | Yükleyenin kendi çalışması |
| Yazar | Adrien F. Vincent |
Rationale: this work aims at providing an up-to-date version of the previous work https://en.wikipedia.org/wiki/File:Matplotlib_screenshot.png , done by Geek3.
The matplotlib (mpl) version is the development branch 2.x, with Python 2.7.11 and numpy 1.11.1
##########
## Code for the mpl logo figure
##########
import matplotlib.pyplot as plt
import numpy as np

from matplotlib.cm import jet as colormap
from matplotlib.ticker import NullFormatter, MultipleLocator

t, w, r = zip((0.1, 0.4, 1), (0.9, 0.3, 5), (1.7, 0.5, 7), (2.7, 0.6, 6),
              (3.5, 0.3, 3), (4.5, 0.4, 4), (5.3, 0.3, 7))

fig, ax = plt.subplots(subplot_kw={'polar': True})
bars = ax.bar(t, r, width=w, bottom=0.0, lw=2, edgecolor='Black', zorder=2)

for r, bar in zip(r, bars):
    bar.set_facecolor(colormap(r / 9.0))
    bar.set_alpha(0.7)

ax.yaxis.set_major_locator(MultipleLocator(2))

for axis in (ax.xaxis, ax.yaxis):
    axis.set_major_formatter(NullFormatter())  # no tick labels

ax.set_ylim([0, 8])
ax.grid(True)

plt.show()
####################
##########
## Code for the 3D surface plot and the 2D random walk tajectories
##########
import matplotlib.pyplot as plt
import numpy as np

from mpl_toolkits.mplot3d import Axes3D
from matplotlib.cm import viridis as colormap

"""
Figure 1: a 3D surface plot (from matplotlib gallery)
"""
step = 0.04
maxval = 1.0
fig1 = plt.figure("Figure_1")
ax1 = fig1.add_subplot(111, projection='3d')

# Create supporting points in polar coordinates
r = np.linspace(0, 1.2, 50)
p = np.linspace(0, 2*np.pi, 50)
R, P = np.meshgrid(r, p)
# Transform them to cartesian system
X, Y = R*np.cos(P), R*np.sin(P)

Z = ((R**2 - 1)**2)
ax1.plot_surface(X, Y, Z, rstride=1, cstride=1, cmap=colormap)
ax1.set_zlim3d(0, 1)
ax1.set_xlabel(r'$\phi_\mathrm{real}$')
ax1.set_ylabel(r'$\phi_\mathrm{im}$')
ax1.set_zlabel(r'$V(\phi)$')

"""
Figure 2: a few examples of 2D random walk
"""
fig2, ax2 = plt.subplots(num="Figure_2")

prng = np.random.RandomState(123)

x = np.linspace(0, 10, 101)

def random_walk(xy0=(0.0, 0.0), nsteps=100, std=1.0):
    xy = np.zeros((nsteps + 1, 2))
    xy[0,:] = xy0
    deltas = prng.normal(loc=0.0, scale=std, size=(nsteps, 2))
    xy[1:, :] = xy[0, :] + np.cumsum(deltas, axis=0)
    return xy

for cnt in range(3):
    traj = random_walk()
    ax2.plot(traj[:, 0], traj[:, 1], label="Traj. {c}".format(c=cnt))

ax2.legend(loc='best')

plt.show()
####################
Lisanslama
Ben, bu işin telif sahibi, burada işi aşağıdaki lisans altında yayımlıyorum:
Bu dosya, Creative Commons Atıf-Benzer Paylaşım 4.0 Uluslararası lisansı ile lisanslanmıştır.
- Şu seçeneklerde özgürsünüz:
- paylaşım – eser paylaşımı, dağıtımı ve iletimi
- içeriği değiştirip uyarlama – eser adaptasyonu
- Aşağıdaki koşullar geçerli olacaktır:
- atıf – Esere yazar veya lisans sahibi tarafından belirtilen (ancak sizi ya da eseri kullanımınızı desteklediklerini ileri sürmeyecek bir) şekilde atıfta bulunmalısınız.
- benzer paylaşım – Maddeyi yeniden karıştırır, dönüştürür veya inşa ederseniz, katkılarınızı orijinal olarak aynı veya uyumlu lisans altında dağıtmanız gerekir.
Dosya geçmişi
Dosyanın herhangi bir zamandaki hâli için ilgili tarih/saat kısmına tıklayın.
| Tarih/Saat | Küçük resim | Boyutlar | Kullanıcı | Yorum | |
|---|---|---|---|---|---|
| güncel | 09.52, 27 Eylül 2016 | | 1.227 × 978 (350 KB) | Adrien F. Vincent | User created page with UploadWizard |
Dosya kullanımı
Bu görüntü dosyasına bağlantısı olan sayfalar:
Küresel dosya kullanımı
Aşağıdaki diğer vikiler bu dosyayı kullanır:
- bn.wikipedia.org üzerinde kullanımı
- en.wikipedia.org üzerinde kullanımı
- fr.wikipedia.org üzerinde kullanımı
- hu.wikipedia.org üzerinde kullanımı
- ja.wikipedia.org üzerinde kullanımı
- ko.wikipedia.org üzerinde kullanımı
- pl.wikipedia.org üzerinde kullanımı
- pt.wikipedia.org üzerinde kullanımı
- sr.wikipedia.org üzerinde kullanımı
- zh.wikipedia.org üzerinde kullanımı