Dosya:Five Myr Climate Change.svg

Tam çözünürlük (SVG dosyası, sözde 1.024 × 372 piksel, dosya boyutu: 68 KB)
Bu dosya Wikimedia Commons'ta bulunmaktadır. Dosyanın açıklaması aşağıda gösterilmiştir. Commons, serbest/özgür telifli medya dosyalarının bulundurulduğu depodur. Siz de yardım edebilirsiniz. |
Özet
| Açıklama |
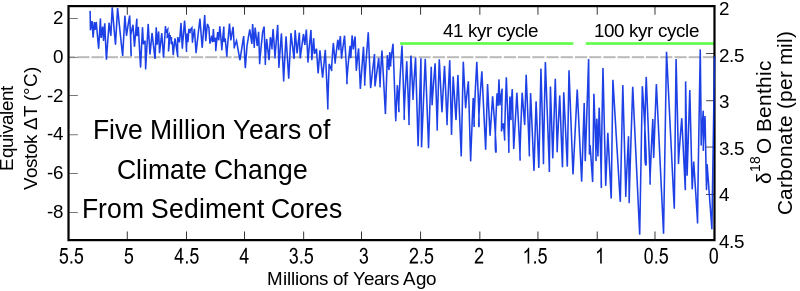
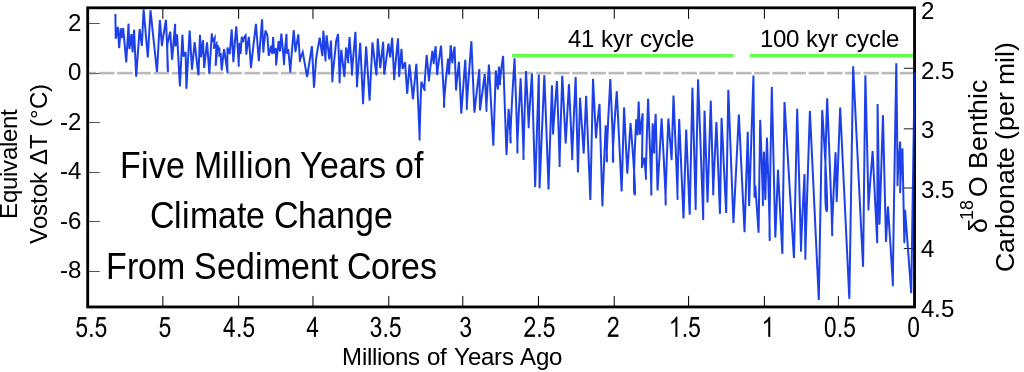
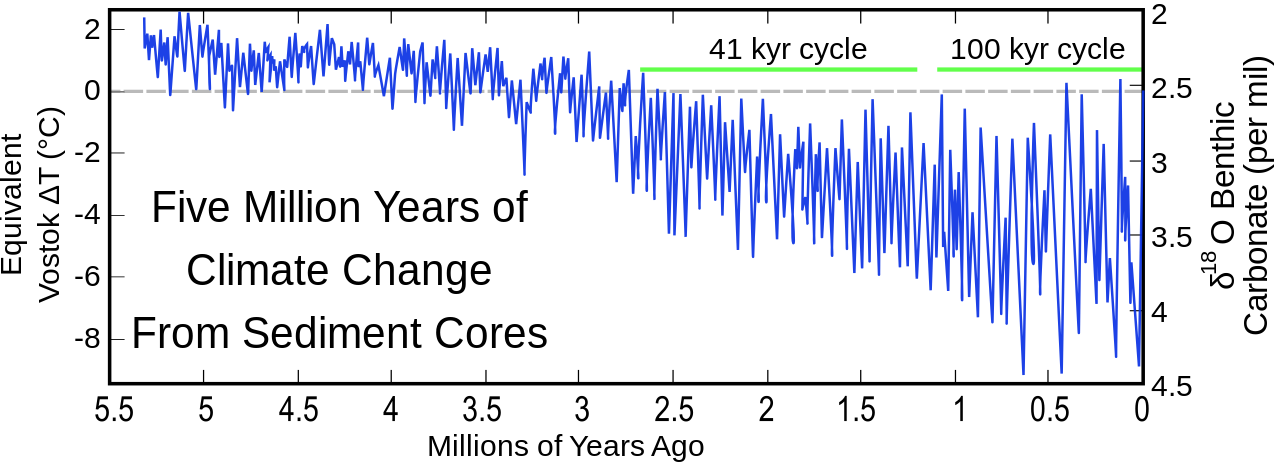
reconstruction of the past 5 million years of climate history, based on oxygen isotope fractionation (serving as a proxy for the total global mass of glacial ice sheets). See the discussion below for a summary of the methods and models used. Català: Reconstrucció dels darrers cinc milions d'anys de la història del clima, basada en el fraccionament d'isòtops d'oxigen (que serveix com a proxy de la massa global total de les capes de gel glacials). Русский: Реконструкция истории климата за последние пять миллионов лет на основе значений δ18O. Эта величина, производная от отношения изотов кислорода 18O и 16O (см. δ18O (en)), выступает в роли заменителя (прокси) глобальной температуры.
Note that the resolution of the graph has suffered in the conversion from png to svg. Use the original png if possible. Also note that in 2010, User:SeL media switched the orientation of the time axis and the vertical axes, apparently without discussion, and some descriptions of the image may refer to the older version, resulting in confusion of 'right' and 'left' in the image. |
| Tarih | (svg file 2009-02-07) |
| Kaynak | svg-version of Five_Myr_Climate_Change.png; original image by User:Dragons flight, based on data (figure 4?) from Lisiecki and Raymo (2005) |
| Yazar | Dragons flight (Robert A. Rohde), svg by Jo |
| İzin (Bu dosyanın tekrar kullanımı) |
This figure was prepared by Robert A. Rohde based on published data and is incorporated into the Global Warming Art project. |
| Diğer sürümler |
Five_Myr_Climate_Change.png, Bu dosyanın türev çalışmaları: Five Myr Climate Change-ml.svg, Five Myr Climate Change (de), Five Myr Climate Change (fr) File:Five Myr Climate Change.svg has 3 translations.
|


.svg)
.svg)
Discussion


This figure shows the climate record of Lisiecki and Raymo (2005) [1] constructed by combining measurements from 57 globally distributed deep sea sediment cores. The measured quantity is oxygen isotope fractionation (δ18O) in benthic foraminifera, which serves as a proxy for the total global mass of glacial ice sheets.
Lisiecki and Raymo constructed this record by first applying a computer aided process of adjusting individual "wiggles" in each sediment core to have the same alignment (i.e. wiggle matching). Then the resulting stacked record is orbitally tuned by adjusting the positions of peaks and valleys to fall at times consistent with an orbitally driven ice model (see: Milankovitch cycles). Both sets of these adjustments are constrained to be within known uncertainties on sedimentation rates and consistent with independently dated tie points (if any). Constructions of this kind are common, however they presume that ice sheets are orbitally driven, and hence data such as this can not be used in establishing the existence of such a relationship.
The observed isotope variations are very similar in shape to the temperature variations recorded at Vostok, Antarctica during the 420 kyr for which that record exists. Hence the right hand scale of the figure was established by fitting the reported temperature variations at Vostok (Petit et al. 1999) to the observed isotope variations. Hence, this temperature scale should be regarded as approximate and its magnitude is only representative of Vostok changes. In particular, temperature changes at polar sites, such as Vostok, frequently exceed the changes observed in the tropics or in the global average. A horizontal line at 0 °C indicates modern temperatures (circa 1950).
Labels are added to indicate regions where 100 kyr and 41 kyr cyclicity is observed. These periodicities match periodic changes in Earth's orbital eccentricity and obliquity respectively, and have been previously established by other studies (not relying on orbital tuning). For discussion of how such orbital changes might drive climate change, see Milankovitch cycles.
References
- Lisiecki, L. E., and M. E. Raymo (2005), A Pliocene-Pleistocene stack of 57 globally distributed benthic δ18O records, Paleoceanography, 20, PA1003, doi:10.1029/2004PA001071; data: doi:10.1594/PANGAEA.704257. — bundled as {{cite DOI|10.1029/2004PA001071}}
- Petit J.R., Jouzel J., Raynaud D., Barkov N.I., Barnola J.M., Basile I., Bender M., Chappellaz J., Davis J., Delaygue G., Delmotte M., Kotlyakov V.M., Legrand M., Lipenkov V., Lorius C., Pépin L., Ritz C., Saltzman E., Stievenard M. (1999) Climate and Atmospheric History of the Past 420,000 years from the Vostok Ice Core, Antarctica, Nature, 399, pp.429-436, doi:10.1038/20859.
Lisanslama

|
Bu belgenin GNU Özgür Belgeleme Lisansı, Sürüm 1.2 veya Özgür Yazılım Vakfı tarafından yayımlanan sonraki herhangi bir sürüm şartları altında bu belgenin kopyalanması, dağıtılması ve/veya değiştirilmesi için izin verilmiştir;
Değişmeyen Bölümler, Ön Kapak Metinleri ve Arka Kapak Metinleri yoktur. Lisansın bir kopyası GNU Özgür Belgeleme Lisansı sayfasında yer almaktadır. |
| Bu dosya, Creative Commons Atıf-Benzer Paylaşım 3.0 Taşınmamış lisansı ile lisanslanmıştır | ||
| ||
| Bu lisanslama etiketi, dosyaya GFDL lisanslama güncelleştirmenin bir parçası olarak eklenmiştir. |
| Dragons flight's Temperature Record Series |
| This figure is part of a series of plots created by Dragons flight to illustrate changes in Earth's temperature and climate across many different time scales. |
| Time Period: 25 yrs | 150 yrs | 1 kyr | 2 kyr | 12 kyr | 450 kyr | 5 Myr | 65 Myr | 500 Myr |
| For articles related to this topic see: Temperature record |
Dosya geçmişi
Dosyanın herhangi bir zamandaki hâli için ilgili tarih/saat kısmına tıklayın.
| Tarih/Saat | Küçük resim | Boyutlar | Kullanıcı | Yorum | |
|---|---|---|---|---|---|
| güncel | 20.06, 6 Ocak 2024 | 1.024 × 372 (68 KB) | Ivsetaki | Added a Russian translation. | |
| 14.58, 4 Ekim 2023 | 1.024 × 372 (61 KB) | EnjolrasXXI | File uploaded using svgtranslate tool (https://svgtranslate.toolforge.org/). Added translation for ca. | ||
| 13.45, 18 Temmuz 2010 | 1.024 × 372 (55 KB) | SeL media | time axis reversed | ||
| 22.16, 7 Şubat 2009 | 1.024 × 372 (51 KB) | Jo Weber | some minor fixes | ||
| 21.42, 7 Şubat 2009 | 1.025 × 393 (50 KB) | Jo Weber | Changed text to path | ||
| 21.39, 7 Şubat 2009 | 1.025 × 393 (32 KB) | Jo Weber | {{Information |Description=svg-version of Five_Myr_Climate_Change.png |Source=see below |Date=2009-02-07 |Author=Dragons flight, svg by Jo |Permission=see below |other_version |
Dosya kullanımı
Bu görüntü dosyasına bağlantısı olan sayfalar:
Küresel dosya kullanımı
Aşağıdaki diğer vikiler bu dosyayı kullanır:
- azb.wikipedia.org üzerinde kullanımı
- bg.wikipedia.org üzerinde kullanımı
- bn.wikipedia.org üzerinde kullanımı
- ca.wikipedia.org üzerinde kullanımı
- cs.wikipedia.org üzerinde kullanımı
- en.wikipedia.org üzerinde kullanımı
- Ice age
- Stone Age
- Climate of Antarctica
- Milankovitch cycles
- Marine isotope stages
- Environmental isotopes
- Marine Isotope Stage 11
- Marine Isotope Stage 5
- User:Mark Buchanan/sandbox/Glaciation-WIP
- Marine Isotope Stage 13
- User:Dtolson1/sandbox
- User:Klakhani1118/sandbox
- Mid-Pleistocene Transition
- Don Glaciation
- User:Scienceislife22/Marine Isotope Stage 9
- en.wikibooks.org üzerinde kullanımı
- en.wikiversity.org üzerinde kullanımı
- es.wikipedia.org üzerinde kullanımı
- fa.wikipedia.org üzerinde kullanımı
- he.wikipedia.org üzerinde kullanımı
- it.wikipedia.org üzerinde kullanımı
- ja.wikipedia.org üzerinde kullanımı
- mk.wikipedia.org üzerinde kullanımı
- ms.wikipedia.org üzerinde kullanımı
- no.wikipedia.org üzerinde kullanımı
- pl.wikipedia.org üzerinde kullanımı
- pt.wikipedia.org üzerinde kullanımı
- ru.wikipedia.org üzerinde kullanımı
- sl.wikipedia.org üzerinde kullanımı
- sv.wikipedia.org üzerinde kullanımı
- te.wikipedia.org üzerinde kullanımı
Bu dosyanın daha fazla küresel kullanımını görüntüle.