Dosya:South Africa 2011 dominant language map.svg

Bu SVG dosyasının PNG önizlemesinin boyutu: 684 × 599 piksel. Diğer çözünürlükler: 274 × 240 piksel | 548 × 480 piksel | 876 × 768 piksel | 1.168 × 1.024 piksel | 2.337 × 2.048 piksel | 809 × 709 piksel.
Tam çözünürlük (SVG dosyası, sözde 809 × 709 piksel, dosya boyutu: 798 KB)
Bu dosya Wikimedia Commons'ta bulunmaktadır. Dosyanın açıklaması aşağıda gösterilmiştir. Commons, serbest/özgür telifli medya dosyalarının bulundurulduğu depodur. Siz de yardım edebilirsiniz. |
Özet
| Açıklama |
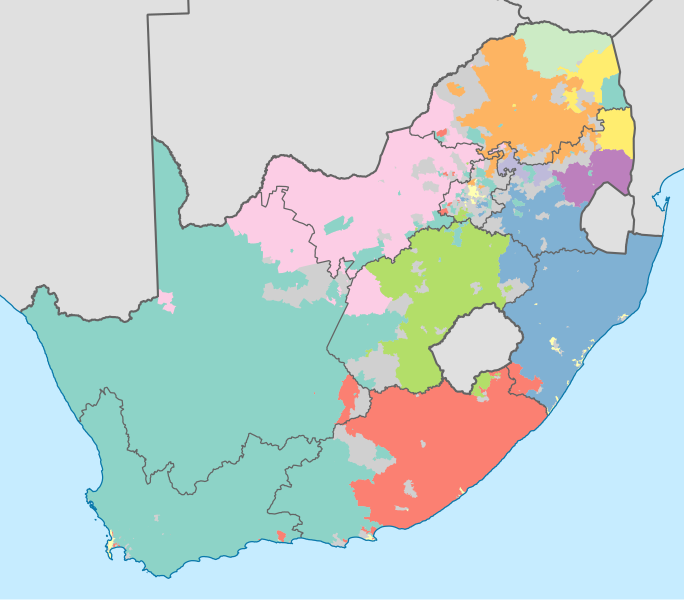
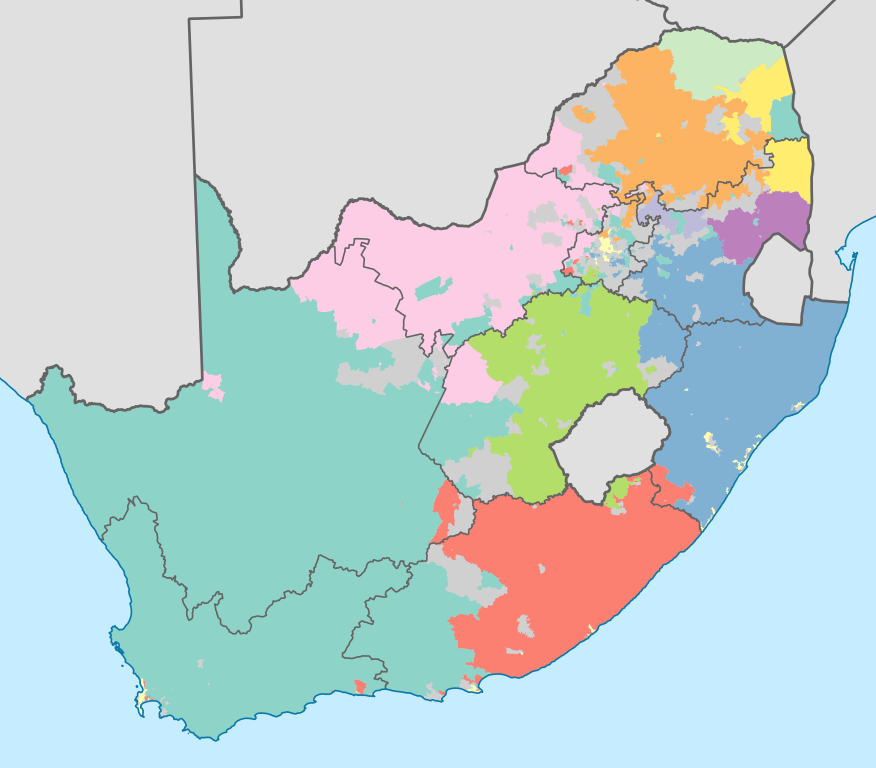
English: Map showing the dominant home languages in South Africa, based on ward-level data from the 2011 census. In this context, a language is dominant if it more than 50% of the population in a ward speak it at home, or more than 33% speak it and no other language is spoken by more than 25%.
English
Afrikaans
isiNdebele
isiXhosa
isiZulu
Sesotho sa Leboa
Sesotho
Setswana
siSwati
Tshivenda
Xitsonga
No language dominant
Projection is Albers Equal-Area Conic, with standard parallels at 25.5° S and 31.5° S, and origin at 28.5° S 24.5° E. |
| Tarih | |
| Kaynak | Statistics South Africa's Census 2011 is the source of the basic population data. The map results from my own processing of the data. For ward boundaries see File:South Africa electoral wards 2011 blank.svg. |
| Yazar | Htonl |
| Diğer sürümler |
South Africa 2011 dominant language map (hex cells).svg: .svg) |
Lisanslama
The following license applies to the population data on which the map is based:

|
Bu dosyanın telif hakkı sahibi, Stats SA, telif hakkına uygun şekilde atıfta bulunmak koşuluyla herkese herhangi bir amaç için bu çalışmayı kullanmak üzere izin vermiştir. |
Atıf:
"the user acknowledges Stats SA as the source of the basic data wherever they process, apply, utilise, publish or distribute the data, and also that they specify that the relevant application and analysis (where applicable) result from their own processing of the data" [1]
|
The following tag applies to the map itself:
| Ben, bu işin telif sahibi, bu işi kamu malı olarak yayınlıyorum. Bu dünya çapında geçerlidir. Bazı ülkelerde bu yasal olarak mümkün olmayabilir; öyleyse: Ben, bu işi herhangi bir amaç için, herhangi bir şart olmaksızın, yasalarca gerekli olmadıkça, herkesin kullanmasına izin veriyorum. |
Dosya geçmişi
Dosyanın herhangi bir zamandaki hâli için ilgili tarih/saat kısmına tıklayın.
| Tarih/Saat | Küçük resim | Boyutlar | Kullanıcı | Yorum | |
|---|---|---|---|---|---|
| güncel | 21.09, 18 Kasım 2012 | | 809 × 709 (798 KB) | Htonl | =={{int:filedesc}}== {{Information |Description={{en|1=Map showing the dominant home languages in South Africa, based on ward-level data from the 2011 census. In this context, a language is dominant if it more than 50% of the population in a ward speak... |
Dosya kullanımı
Bu görüntü dosyasına bağlantısı olan sayfalar:
Küresel dosya kullanımı
Aşağıdaki diğer vikiler bu dosyayı kullanır:
- af.wikipedia.org üzerinde kullanımı
- cs.wikipedia.org üzerinde kullanımı
- de.wikipedia.org üzerinde kullanımı
- dsb.wikipedia.org üzerinde kullanımı
- en.wikipedia.org üzerinde kullanımı
- eo.wikipedia.org üzerinde kullanımı
- frr.wikipedia.org üzerinde kullanımı
- fr.wikipedia.org üzerinde kullanımı
- fr.wiktionary.org üzerinde kullanımı
- he.wikipedia.org üzerinde kullanımı
- it.wikipedia.org üzerinde kullanımı
- ka.wikipedia.org üzerinde kullanımı
- ko.wikipedia.org üzerinde kullanımı
- lb.wikipedia.org üzerinde kullanımı
- ml.wikipedia.org üzerinde kullanımı
- mzn.wikipedia.org üzerinde kullanımı
- no.wikipedia.org üzerinde kullanımı
- pt.wikipedia.org üzerinde kullanımı
- rm.wikipedia.org üzerinde kullanımı
- ro.wikipedia.org üzerinde kullanımı
- ru.wikipedia.org üzerinde kullanımı
- sh.wikipedia.org üzerinde kullanımı
- simple.wikipedia.org üzerinde kullanımı
- sr.wikipedia.org üzerinde kullanımı
- ss.wikipedia.org üzerinde kullanımı
- sv.wikipedia.org üzerinde kullanımı
- sw.wikipedia.org üzerinde kullanımı
- szl.wikipedia.org üzerinde kullanımı
- te.wikipedia.org üzerinde kullanımı
- tg.wikipedia.org üzerinde kullanımı
- uk.wikipedia.org üzerinde kullanımı
- xh.wikipedia.org üzerinde kullanımı
- zh.wikipedia.org üzerinde kullanımı
- zu.wikipedia.org üzerinde kullanımı