Dosya:07 July - Percent of global area at temperature records - Global warming - NOAA.svg

Bu SVG dosyasının PNG önizlemesinin boyutu: 800 × 560 piksel. Diğer çözünürlükler: 320 × 224 piksel | 640 × 448 piksel | 1.024 × 717 piksel | 1.280 × 896 piksel | 2.560 × 1.792 piksel | 1.000 × 700 piksel.
Tam çözünürlük (SVG dosyası, sözde 1.000 × 700 piksel, dosya boyutu: 5 KB)
Bu dosya Wikimedia Commons'ta bulunmaktadır. Dosyanın açıklaması aşağıda gösterilmiştir. Commons, serbest/özgür telifli medya dosyalarının bulundurulduğu depodur. Siz de yardım edebilirsiniz. |
Özet
| Açıklama |
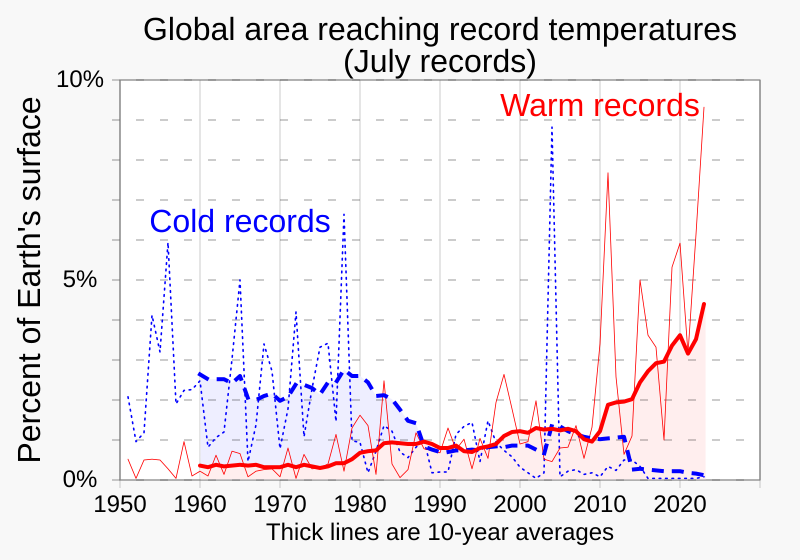
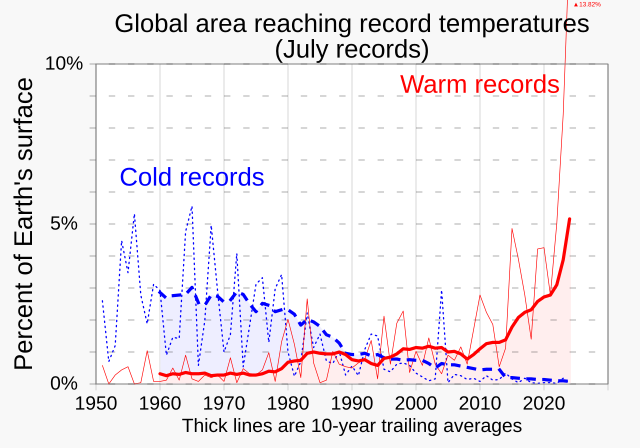
English: Line graphs of the percentages of Earth's surface reaching a record July temperature as a function of time over years 1951-, from NOAA data.
|
||
| Tarih | |||
| Kaynak | Yükleyenin kendi çalışması | ||
| Yazar | RCraig09 |

Related files
-
 01 January - Percent of global area at temperature records - Global warming - NOAA.svg
(January data) -
 02 February - Percent of global area at temperature records - Global warming - NOAA.svg
(February data) -
 03 March - Percent of global area at temperature records - Global warming - NOAA.svg
(March data) -
 04 April - Percent of global area at temperature records - Global warming - NOAA.svg
(April data) -
 05 May - Percent of global area at temperature records - Global warming - NOAA.svg
(May data) -
 06 June - Percent of global area at temperature records - Global warming - NOAA.svg
(June data)


-
 07 July - Percent of global area at temperature records - Global warming - NOAA.svg
(July data) -
 08 August - Percent of global area at temperature records - Global warming - NOAA.svg
(August data) -
 09 September - Percent of global area at temperature records - Global warming - NOAA.svg
(September data) -
 10 October - Percent of global area at temperature records - Global warming - NOAA.svg
(October data) -
 11 November - Percent of global area at temperature records - Global warming - NOAA.svg
(November data) -
 12 December - Percent of global area at temperature records - Global warming - NOAA.svg
(December data)


-
 1951+ Percent of global area at temperature records - Seasonal comparison - NOAA.svg
Seasonal comparison -
 1951 - Percent of global area at temperature records (monthly) - Global warming - NOAA.svg
All months scatterplot/dot plot -
 1951- RATIO of new record warm temperatures to new record cold temperatures (monthly) - Global warming.svg
Ratios scatterplot/dot plot (monthly) -
 1951- Percent of record temperatures that are cold or warm records.svg
 -
 1951- Warm and cold record temperatures - bar chart.svg

_-_Global_warming_-_NOAA.svg)
_-_Global_warming.svg)


Lisanslama
Ben, bu işin telif sahibi, burada işi aşağıdaki lisans altında yayımlıyorum:
Bu dosya, Creative Commons Atıf-Benzer Paylaşım 4.0 Uluslararası lisansı ile lisanslanmıştır.
- Şu seçeneklerde özgürsünüz:
- paylaşım – eser paylaşımı, dağıtımı ve iletimi
- içeriği değiştirip uyarlama – eser adaptasyonu
- Aşağıdaki koşullar geçerli olacaktır:
- atıf – Esere yazar veya lisans sahibi tarafından belirtilen (ancak sizi ya da eseri kullanımınızı desteklediklerini ileri sürmeyecek bir) şekilde atıfta bulunmalısınız.
- benzer paylaşım – Maddeyi yeniden karıştırır, dönüştürür veya inşa ederseniz, katkılarınızı orijinal olarak aynı veya uyumlu lisans altında dağıtmanız gerekir.
Dosya geçmişi
Dosyanın herhangi bir zamandaki hâli için ilgili tarih/saat kısmına tıklayın.
| Tarih/Saat | Küçük resim | Boyutlar | Kullanıcı | Yorum | |
|---|---|---|---|---|---|
| güncel | 03.42, 15 Ağustos 2023 | | 1.000 × 700 (5 KB) | RCraig09 | Version 20: update to include data through July 2023 |
| 03.54, 29 Temmuz 2023 |  | 1.000 × 700 (7 KB) | RCraig09 | Version 9: centering some text strings . . . making "(July records)" more conspicuous | |
| 15.18, 28 Temmuz 2023 |  | 1.000 × 700 (7 KB) | RCraig09 | Version 8: created new graphic for JULY figures.... but only through July 2021 . . . I plan to update when July 2023 data becomes available | |
| 16.47, 15 Haziran 2023 |  | 1.000 × 700 (9 KB) | RCraig09 | Version 7: arrange order of code to make horizontal gridlines appear in front of colored areas | |
| 22.09, 25 Mayıs 2023 |  | 1.000 × 700 (9 KB) | RCraig09 | Version 6: Add blue fill area . . . . simplify horizontal axis | |
| 15.50, 25 Mayıs 2023 |  | 1.000 × 750 (9 KB) | RCraig09 | Version 5: changed dark blue line to dashed line . . . . making read fill-area be under 10-year average (rather than under annual numbers which are not as smooth a trace) | |
| 05.15, 25 Mayıs 2023 |  | 1.000 × 750 (9 KB) | RCraig09 | Version 4: Add 10-year moving averages traces | |
| 18.50, 24 Mayıs 2023 |  | 1.000 × 750 (6 KB) | RCraig09 | Version 3: update to include data through April 2023 . . . . add shading under red trace | |
| 19.31, 2 Eylül 2021 |  | 1.000 × 750 (5 KB) | RCraig09 | Version 2: Amending title to be more descriptive | |
| 19.06, 2 Eylül 2021 |  | 1.000 × 750 (5 KB) | RCraig09 | Uploaded own work with UploadWizard |
Dosya kullanımı
Bu görüntü dosyasına bağlantısı olan sayfalar:
Küresel dosya kullanımı
Aşağıdaki diğer vikiler bu dosyayı kullanır:
- bn.wikipedia.org üzerinde kullanımı
- en.wikipedia.org üzerinde kullanımı
- es.wikipedia.org üzerinde kullanımı
- fa.wikipedia.org üzerinde kullanımı
- ja.wikipedia.org üzerinde kullanımı
- no.wikipedia.org üzerinde kullanımı