Dosya:Pearson type VII distribution PDF.svg

Tam çözünürlük (SVG dosyası, sözde 400 × 300 piksel, dosya boyutu: 74 KB)
Bu dosya Wikimedia Commons'ta bulunmaktadır. Dosyanın açıklaması aşağıda gösterilmiştir. Commons, serbest/özgür telifli medya dosyalarının bulundurulduğu depodur. Siz de yardım edebilirsiniz. |
Özet
| Açıklama |
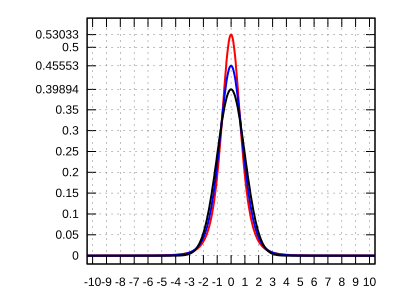
English: Probability density function of the Pearson type VII distribution
The red curve shows the limiting density with infinite kurtosis; the blue curve shows the density with kurtosis equal to 2; the black curve shows the limiting (normal) density with kurtosis identically zero. |
||||||
| Tarih | |||||||
| Kaynak | MarkSweep | ||||||
| Yazar |
Vektör: |
||||||
| İzin (Bu dosyanın tekrar kullanımı) |
Ben, bu işin telif sahibi, burada işi aşağıdaki lisans altında yayımlıyorum:
|
||||||
| Diğer sürümler |
File:Pearson_type_VII_distribution_log-PDF.svg File:Pearson_type_VII_distribution_PDF.png File:Pearson_type_VII_distribution_log-PDF.png |
||||||
| SVG gelişimi | Bu SVG kaynak kodu geçerlidir. Bu vektörel grafik Gnuplot ile oluşturuldu. | ||||||
| Kaynak kodu | Gnuplot code# the Pearson type VII log-pdf
log_p7(x,a2,m) = lgamma(m) - lgamma(m-0.5) - m*log(1+x*x/a2) - 0.5*log(a2*pi)
# the Pearson type VII log-pdf with unit variance and kurtosis k
f(x,k) = log_p7(x, 2+6.0/k, 2.5+3.0/k)
# the standard normal log-pdf (with unit variance and kurtosis 0)
n(x) = -0.5 * (x*x + log(2*pi))
# the limit of the Pearson type VII log-pdf for k -> infinity
g(x) = -2.5 * log(2 + x*x) + log(3)
set samples 1001
set grid
set xrange [-10.4:10.4]
set xtics 1
set yrange [-0.02:0.57]
set ytics (0, 0.05, 0.1, 0.15, 0.2, 0.25, 0.3, 0.35, 0.39894, 0.45553, 0.5, 0.53033)
set terminal svg size 400,300 enhanced fname 'DejaVu Sans' fsize 10 butt solid
set output 'Pearson type VII distribution PDF.svg'
plot exp(g(x)) lt 1 lw 2 notitle, \
exp(f(x,2)) lt 3 lw 2 notitle, \
exp(n(x)) lt 7 lw 2 notitle
|
Background
The Pearson type VII family of probability densities is a special case of the type IV family restricted to symmetric densities. The probability density function is given by
- Failed to parse (syntax error): {\displaystyle f(x; a^2, m) = \frac{\Gamma(m)}{\Gamma(m-1/2)\,\sqrt{a^2\,\pi}} \left(1+\frac{x^2}{a^2}\right)^{-m}. \!}
All densities in this family are symmetric with zero mean. Setting makes the variance equal to unity. Then the only free parameter is m, which controls the fourth moment (and cumulant) and hence the kurtosis. One can reparameterize with where k is the kurtosis to obtain a one-parameter leptokurtic family with zero mean, unit variance, zero skew, and arbitrary positive kurtosis k.


In the limit as one obtains the density


shown as the red curve. In the other direction as one obtains the standard normal density as the limiting distribution, shown as the black curve.

Dosya geçmişi
Dosyanın herhangi bir zamandaki hâli için ilgili tarih/saat kısmına tıklayın.
| Tarih/Saat | Küçük resim | Boyutlar | Kullanıcı | Yorum | |
|---|---|---|---|---|---|
| güncel | 18.18, 26 Mayıs 2020 | | 400 × 300 (74 KB) | Andel | == {{int:filedesc}} == {{Information |description=|Description= {{en|1=Probability density function of the Pearson type VII distribution The red curve shows the limiting density with infinite kurtosis; the blue curve shows the density with kurtosis equal to 2; the black curve shows the limiting (normal) density with kurtosis identically zero.}} |date= 2020-05-26 |source=MarkSweep |author={{AutVec|{{U|MarkSweep}}|{{U|Andel}}|Pearson type VII distribution PDF.png}} |permissi... |
Dosya kullanımı
Bu görüntü dosyasına bağlantısı olan sayfalar:
Küresel dosya kullanımı
Aşağıdaki diğer vikiler bu dosyayı kullanır:
- ca.wikipedia.org üzerinde kullanımı
- en.wikipedia.org üzerinde kullanımı
- es.wikipedia.org üzerinde kullanımı
- no.wikipedia.org üzerinde kullanımı
- pt.wikipedia.org üzerinde kullanımı
- uk.wikipedia.org üzerinde kullanımı